There are two main ways to find out how many new opt-ins your brand has received:
- Look at the chart on the main Audiences page
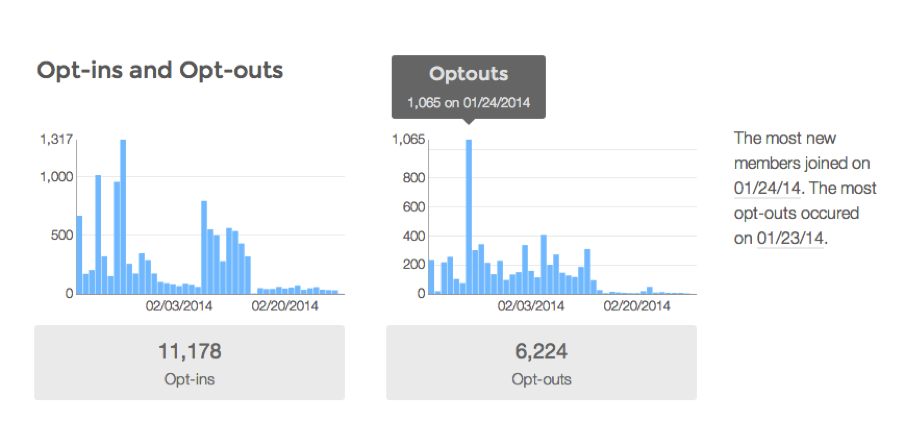
Opt-ins and Opt-outs: The opt-ins and opt-outs graphs capture the overall opt-ins and opt-outs for the chosen time period allowing users to see the daily break down. This chart also shows users the date that the most opt-ins and opt-outs occurred.

The filter feature gives brands the opportunity to sort through your audiences using any information the platform has about your audience. Filters can include: location, communities, birth year, gender, age, or engagement in a trackable activity. Users are given the option to ‘Apply’ these filters for the current data. Applying this data will change the opt-in chart to the information that you are interested in viewing.

- Create a new report mining for this particular data
Reports allow a user to run and export custom inquiries of all available data for any time period during the previous 31 days.
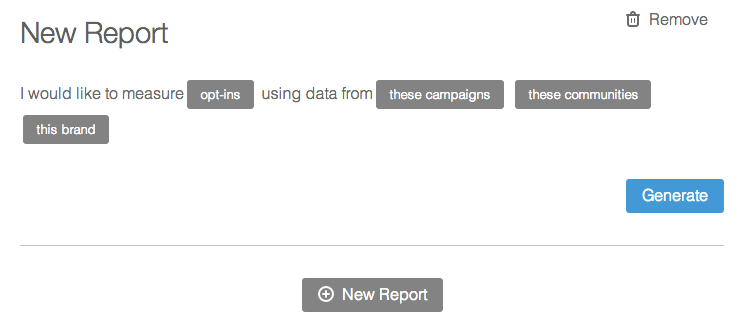
The first step in creating a new report is to click the ‘New Report’ button. You will then want to select that you would like to measure opt-ins.

The majority of new reports pull data from three places: campaigns, communities, or the brand. You can select the data you would like to see in your report and then click generate. This will show you the number of opt-ins according to your specifications.