Audience
Charts
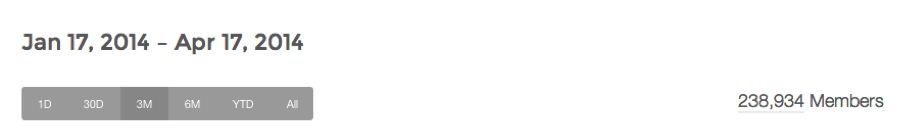
Charts display relevant information about your audience. They also give users the opportunity to sort easily sort through information to have campaign results nicely displayed. There are nine charts displaying the most crucial campaign information. A user will have the option to display charts featuring data from the previous day, 30 days, 3 months, 6 months, year, or all time. To update the length of time of the results, click on the desired length.
Member Growth
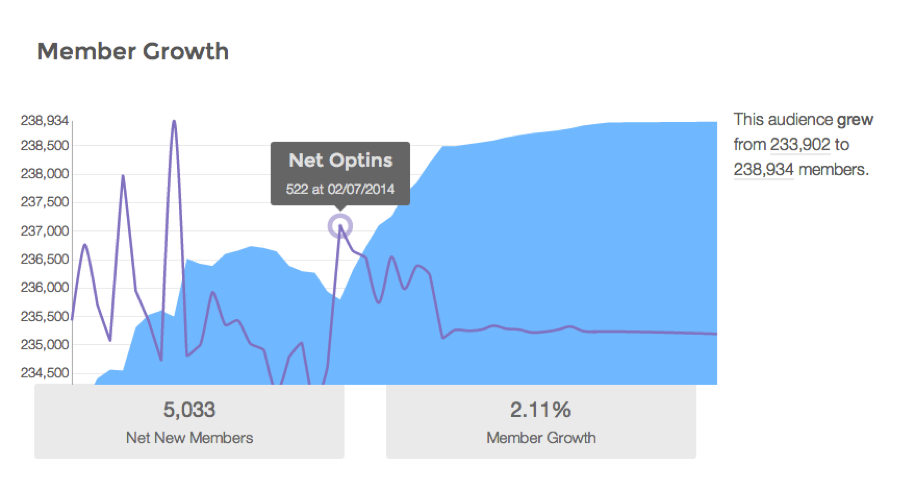
Member Growth captures the net opt-ins, along with the overall size of the community. This graph gives users the opportunity to view the opt-ins and active campaign members by date, gives the net new members over any given time period, and shows the total growth in audience numbers.
Opt-ins and Opt-outs
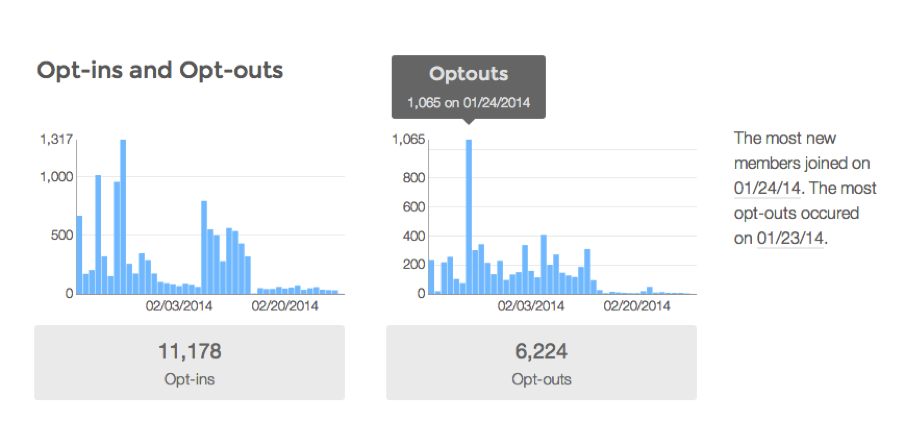
The opt-ins and opt-outs captures the overall opt-ins and opt-outs for the chosen time period allowing users to see the daily break down. This chart also shows users the date that the most opt-ins and opt-outs occurred.
Subscription Channels
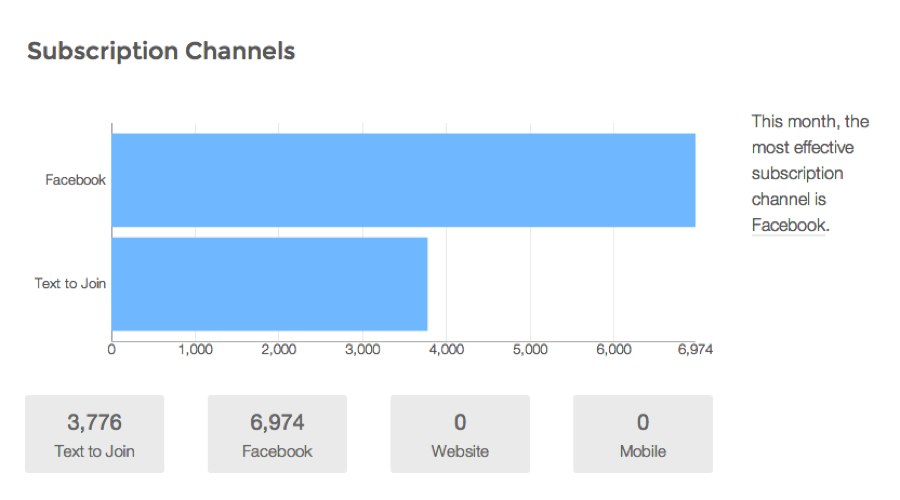
The subscription channels highlight how users are opting into campaigns. This section gives exact number of opt-ins and highlights what the most effective opt-in method for the time period was. This section will adjust according to the different subscription channels that you offer.
Messages to Audience
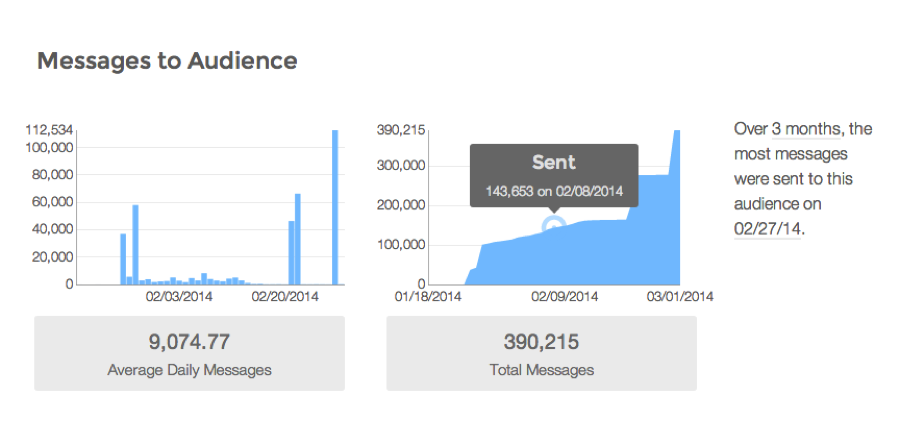
The messages to audiences chart and information shows daily messages and total messages sent. It also highlights the average daily messages and the date that the most messages were sent.
Messages from Audience
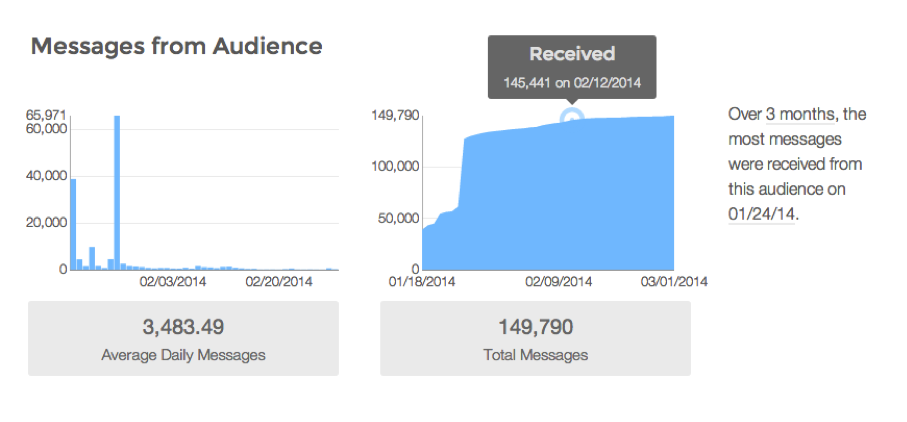
The messages from audiences chart and information shows daily messages and total messages received. It also highlights the average daily messages and the date that the most messages were received.
CTR Performance
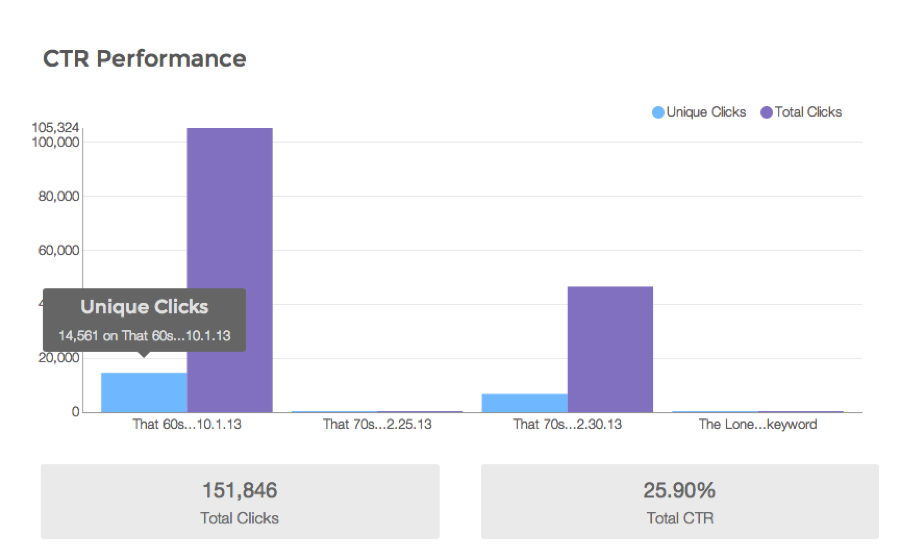
The CTR Performance demonstrates the amount of unique and total clicks per each campaign. It also gives the total and unique amount of clicks for every campaign, the total and unique CTR, and the number of trackable campaigns.
Age and Gender
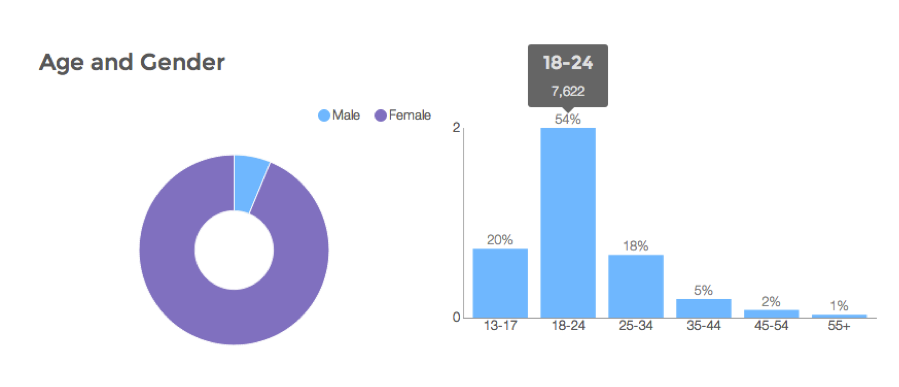
The age and gender chart allows users to see the age and gender distribution of their audience members.
Interests
The interests graph displays the audience’s interests. This information is pulled from Facebook or a brand’s audience data and is useful for segmentation of campaigns.
Geographic
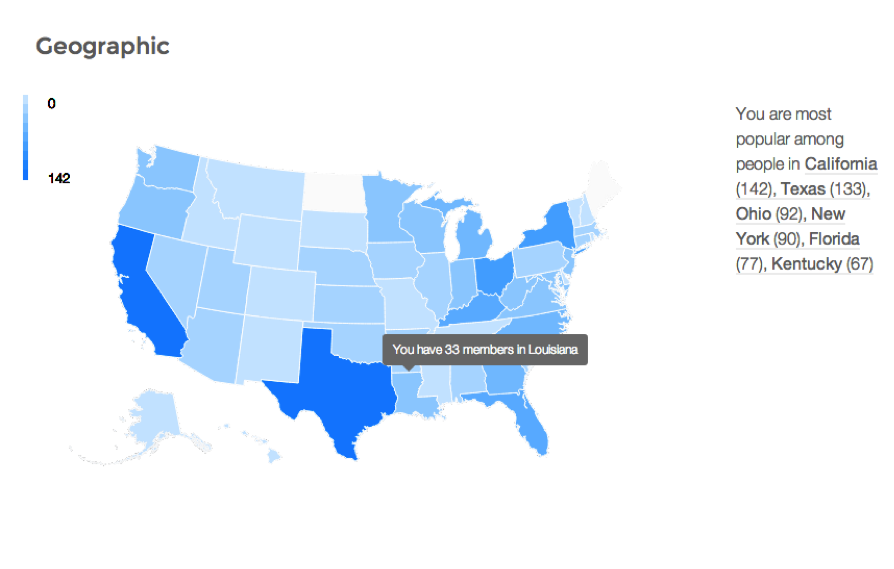
The geographic chart displays audiences by state. It also highlights the most popular states.
List
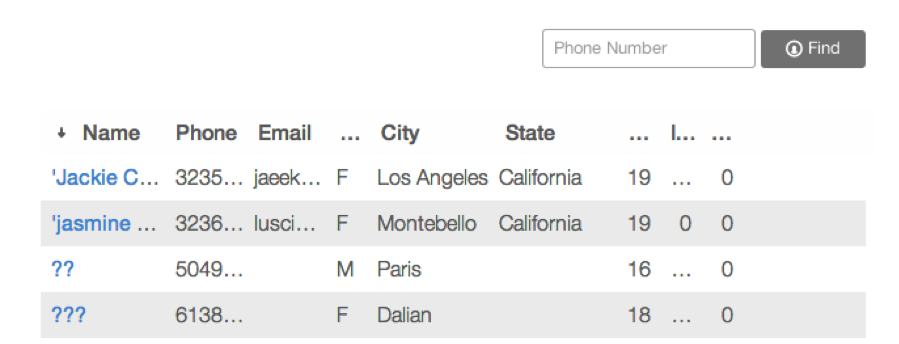
The list feature allows you to sort through your audience by name, phone number, email, sex, city, state, age, influence, and engagement. The List also gives users the opportunity to search by phone number.
Individual Conversation
Sort the Audiences for Viewing in Charts or Lists
By Audience
The sort by audience feature allows the charts or list to only display one audience.
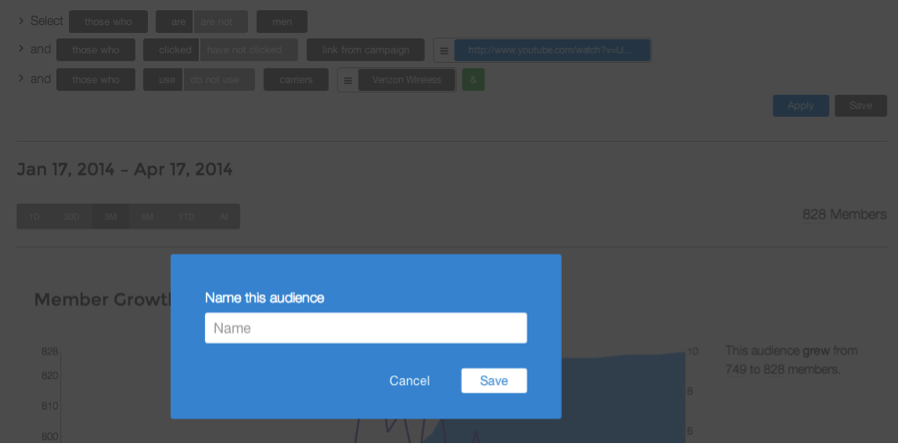
With Filters
The filter feature gives brands the opportunity to sort through their audiences using any information the platform has about your audience. Filters can include: location, communities, birth year, gender, age, or engagement in a trackable activity. Users are given the option to ‘Apply’ these filters for the current data or to ‘Save’ this data and create an additional audience. Once a new audience is created that new audience can be used in the same manner as the previous audiences.
Campaigns
The campaign segment of the platform will allow you to create campaign messaging to send out to audiences.
New Engagement
A new engagement gives a user the opportunity to create a new engagement with a user. This can be accomplished by pressing the New Engagement button in the top-right corner of the Campaigns page. The first step in creating a new engagement is by selecting thy type of the new engagement.
SMS Engagement
Once you have selected an SMS engagement, a user is given the option to create a simple or conversation engagement.
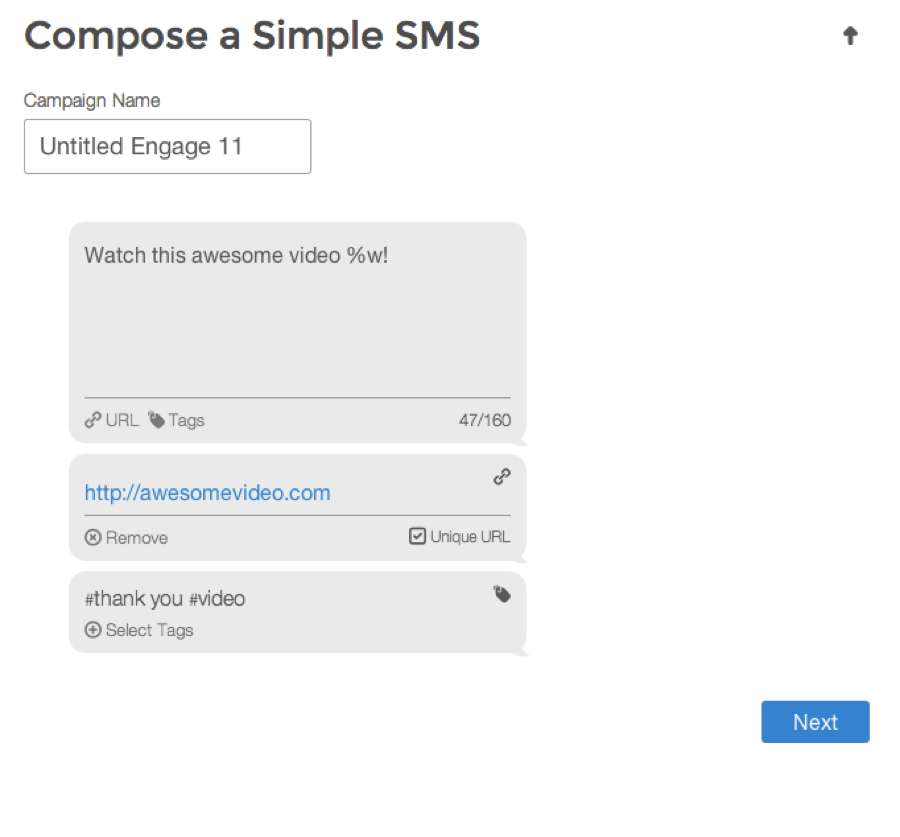
Simple SMS Engagment
A simple SMS engagement is the most common form of communication. It allows a user to send one message to an individual audience. Users are given a place to name the campaign. Then, users can write in the custom message. The simple engagement also gives users the ability to add a unique trackable URL and tags. The platform will measure click through rates. Tags can be viewed on the Manage page.
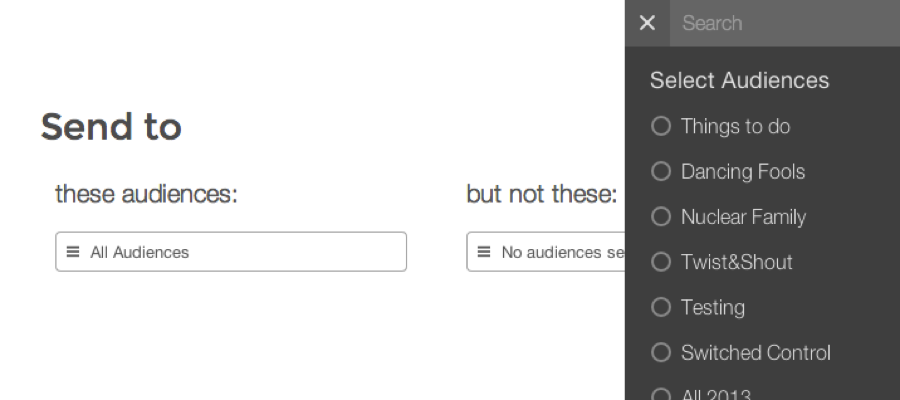
The simple engagement then gives users the options to select certain users to send the campaign to and certain users not to send the campaign to. This feature to not send to certain audiences is beneficial in circumstances when audience members may belong to multiple audiences.
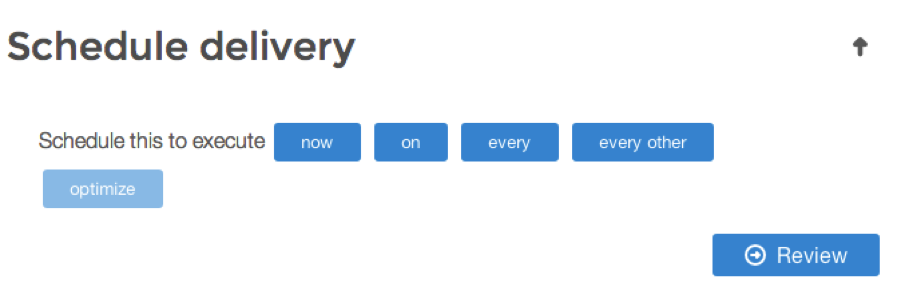
The last step to creating a simple SMS engagement is to schedule delivery. There are options to send out an engagement immediately, to schedule the engagement for a single future date, to schedule the campaign to repeat on a daily, weekly, or monthly basis, or to schedule the campaign to repeat on an every other day, week or month basis.
When scheduling a campaign, a user is also asked to create a campaign end date. This is an important part of creating the campaign, because it shows the effectiveness of the campaign compared to similar to previous campaigns.
Reports
Reports allow a user to run and export custom inquiries of all available data for any time period during the previous 31 days.
 The first step in creating a new report is to click the ‘New Report’ button. A user is then going to want to select one of the many options available to them to segment their data.
 The majority of new reports pull data from three places: campaigns, communities, or the brand.
Once a user has selected the data they would like to see in a report, they would press generate to prepare the report. A user then has the option to export the data to a csv file.
Manage

The manage page separates and details a brand’s communities, audiences, and tags. It also allows a brand to change the name of any of those groups by pressing the pencil button on the right-hand side of the name.